
Manual, explication and more.
Intro
As a former print shop owner, mainly working for artists, I was
interested in the permanence of both paper and inks. Especially
the color constancy of both media. That was the main reason to
create this set of paper white spectral measurements. I’m not the
first to do it and it isn’t the only place on the web where you can
get that information but I try to deliver more content than what
has been available so far. I like to thank my son Kasper Dinkla
for the visualisation of the measurements, for which he applied
an existing open source tool; JFreeChart.
Manual
The application SpectrumViz.jar is a Java based tool.
On most computer systems today the necessary environment to
let it run will be available. If not, download the suitable Java
Runtime Environment and install it. JRE download Oracle/Sun
The application is in a jar type format which makes it instantly
ready for use while the content is sufficiently compressed for
download, so no decompression is needed or should be done.
When the application is started there will be some spectral plots
visible in the main window right away. One is of Barium
Sulphate BaSO4, another Titanium DiOxyde TiO2. In this case
used to give some reference for the other measurements to
known ‘ideal but existing’ white surfaces. Both components are
used as whitening agents in paper coatings. Another spectral plot
represents an Optical Brightening Agent, OBA or sometimes
called Fluorescent Whitening Agent or Fluorescent Brightening
Agent that I prefer.
The plots will disappear as soon as other maps or media choices
in the maps are ticked. A CTRL + mouse click on other maps
and media choices will keep the default curves and add extra
curves. A CTRL+ mouse click on an already selected choice will
onlydeselect that choice. A mouse right click if possible will
have similar functions as a CTRL + left click. A Shift + mouse
click visualises a range of media choices. With the arrow/cursor
on a media name, the weight in Grams per Square Meter and the
Lab color of the paper’s print side is displayed. Other relevant
paper properties will be added there later on. A right click on the
curves window will give some menu choices for display changes
like zooming in and out with different aspect ratios or fixed,
save curve visualisations as png images, copy and print facility,
etc. Dutch language but it will explain itself. Selecting parts of
the curve on the window itself is possible too
Purpose
While it may have been curiosity that fueled my desire to create
this information tool, there could be hidden benefits for its users.
For the print shops that are interested in the archival qualities of
the paper white, the curves will show whether there are
Fluorescent Brightening Agents (FBA) used in the paper and
where in its structure; coating or base. Fluorescence can create
color inconstancy under different lights. The effect often
incorrectly called “Metamerism”. There can be more causes for
that effect though. In absence of FBAs, the total reflection and
the straightness of the curves tell something about the quality of
the normal whiteners used in the inkjet coating and of the paper
base reflectance quality. For the book producers the three curves
of each paper tell something about the papers opacity-
transparency, based on the GSM weight or other properties that
influence opacity. The two curves of measurements on black
board also tell something about reflectance differences of dual
sided papers. The three curves per paper are a good indicator
whether papers with different names and from different suppliers
may come from the same source. If so that could help on
applying suitable ICC print profiles for papers that do not have a
profile available, make a selection of a set of matching white
papers easier and last but not least gives an advantage in the
purchase of the ‘same’ paper from different suppliers. Spectral
measurements do not tell all about the paper and its coating but
they shouldn’t be underestimated either.
Basics
For the spectral measurements a new X-Rite Eye One Basic is
used, in this case the version that doesn’t have a UV cut filter as
I was interested in the fluorescence behaviour of the papers. The
software used is X-Rite (Gretag Macbeth) Eye One Share. Three
spectral measurements per media were done, one on the print
side of the paper with a natural (no FBAs) white museum
mounting board underneath the paper to represent a print as
mounted (solid line
curve), the second a measurement on the same side but the paper
resting on a black plastic board (dashed line curve), the third
measurement on the backside of the paper and the paper resting
on a black plastic board (stipple line curve). The Lab value is
derived from the first measurement. Illumination D50, Observer
2°.
In the Miscellaneous map the Pressed PTFE Tile spectral plot
was reconstructed from a research article graphic and the three
measurements on one Teflon Roll were done by me with the Eye
One Basic. The PTFE-Teflon choices are a bit out of context
here but another idea still not really explored may bring the
relation later on.
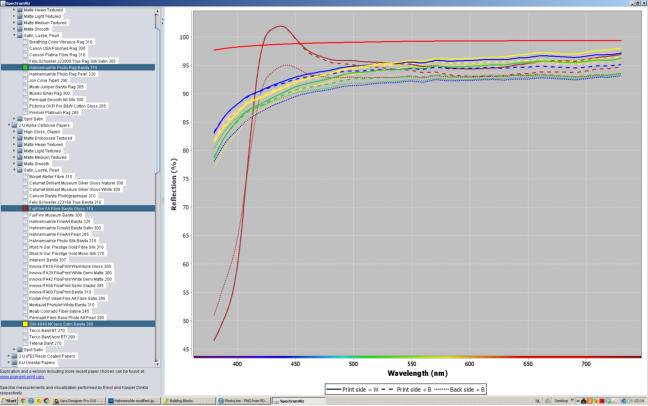
Interpretation of the spectral plots
If we start with the Pressed PTFE Powder (red solid line) we see
what comes close to an ideal white reflectance surface. A
reflectivity just below 100% over a long range of the spectrum,
only a part of that is shown here: 380 to 730 Nm. The opal like
structure of Teflon gives it that high reflectance. There are no
peaks or valleys in the line so it is an ideal continuous spectral
white. The line is slightly inclined so not an absolute neutral
white but most likely the best neutral white you will find on this
planet. Just a (not visible) bit warmer than absolute neutral with
the 99.04 percentage value at 730Nm and 98.37 at 380Nm. The
BaSO4 sample (brown solid line, covered by the red line) is
slightly warmer. No wonder both are used to calibrate optical
instruments on in labs. The Teflon Roll is not visible here, it is
the poor man’s equivalent of a Pressed PTFE Powder tile. The
green and yellow curves represent respectively Canson Rag
Photographique 310 gsm and Moab Entrada Rag Natural 300
gsm dual sided. Two quality matt photo/art papers with a hih
reflectivity for that kind of papers. They are almost identical but
show some interesting small differences. The dual sided coated
Entrada should have identical measurements on the two surfaces
with black underneath, it comes close to that if you look at the
yellow dash and stipple curve. The Photographique’s green
curves separate there slightly more. The Epson Enhanced Matte
represented by the blue curves shows a huge difference between
printable side and the back of the paper. It doesn’t belong in that
class and it shows. Opacity is best checked at the right end of the
curves, the wider the gap between the solid and dashed curve
(same printable side measured respectively with white museum
board and black plastic board underneath) the higher the
transparency, the lower the opacity of the paper. In this case the
Entrada shows more opacity despite its slightly lower weight,
300 versus 310 gsm. Most likely the extra coating side of the
Entrada adds to the opacity. The Epson Enhanced shows a much
wider gap which will be partly caused by its lower weight of 190
gsm but could as well be the result of an inferior coating that
relies more on FBA content for the print side reflectance than on
good quality normal whiteners and a quality paper base. FBA
content is very visible in the Epson Enhanced, the UV light, left
of 420Nm, is absorbed by the agents so doesn’t show reflectance
there and converted to visible light, blue mainly, by the agents it
shows in the form of a bulge at the other side of 420 Nm. With
only the printable side showing that behaviour (solid and dashed
curve) it is clear that the FBA content is in the coating itself, the
paper base doesn’t have it. Most papers in the list that contain
FBA have it both in paper and coating, in some cases more in
the paper than in the coating. There are reasons to expect a better
fade resistance of the FBAs when applied in the paper than in
the coating but much depends on other qualities too. In general
FBAs are not fade resistant and should be avoided for prints that
have to last. The Epson Enhanced’s print side is cooler in color
than the two other papers but its back warmer and less bright
given enough UV light in the illumination of the paper.
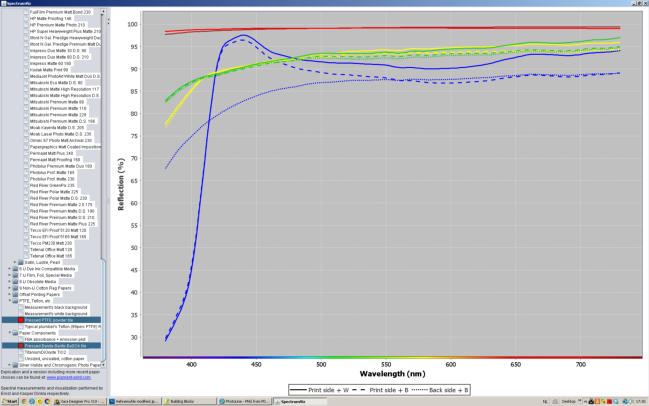
Another example
Three Resin Coated papers, two, like most RC papers, with a
heavy FBA content. The yellow Ilford N Galerie Prestige Lustre
RC most likely has the brighter printing side due to a higher
FBA content in the coating. The green Ilford N Galerie Prestige
Smooth Pearl RC shows a high FBA content in its paper base
and less in its coating. With the FBA in the paper base contained
between the polyethylene (RC) barriers it may last longer, less
affected by gas fading. The Epson Proofing White Semimatt RC
shows an atypical absence of FBA content for an RC paper, it
still has a high white refelction, most likely TiO2 whitening
agent.
The spectrum plots can help in selecting more durable papers,
but real fade and color shifting results of papers are better
collected from fade testing. The Aardenburg Imaging &
Archives founded by Mark McCormick-Goodhart is the best
place to check fading of prints including paper white color
shifts. Any serious print shop should become a member of that
initiative and get full access to all the data collected.
Aardenburg Imaging & Archives
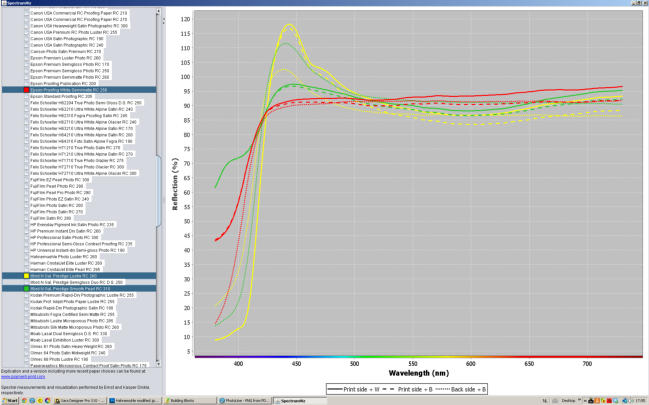
Five sets of measurements of Fibre-Baryta papers, the odd one
out is the FujiFilm Museum Baryte. The remaining four;
Hahnemühle Photorag Baryta, Lumijet Natural Pearl, HP Baryte
Satin, Sihl 4804 Professional Photo Barite have a lot in
common.
Not to spoil your appetite for SpectrumViz itself, the explanation
ends here. More than 700 papers measured already, come back
for new additions.
Copyright on text, illustrations and measurements: Ernst Dinkla
Links to relevant subjects
On the use of optical brighteners in papers, pros and cons:
An Aardenburg Imaging article
Differences between brightness and whiteness of paper:
a Xerox PDF
A reference to SpectrumViz in the book ‘The Digital Print’ by
Jeff Schewe:
www.goodreads.com
Inkjet paper data gathered from printing practice:
Clayton Jones’s The Great Paper Chase

Do you have comments,
advice, a critical note,
suggestions for
SpectrumViz and this
page? Send them to
info@pigment-print.com


Any inkjet paper
manufacturer or
distributor interested in
having its papers
included in the list, can
send samples to me,
preferably several A3 or
A4 sized sheets per
quality. I need more
sheets for some print
tests later on, the
results will be added to
the paper properties.
Snailmail address here.